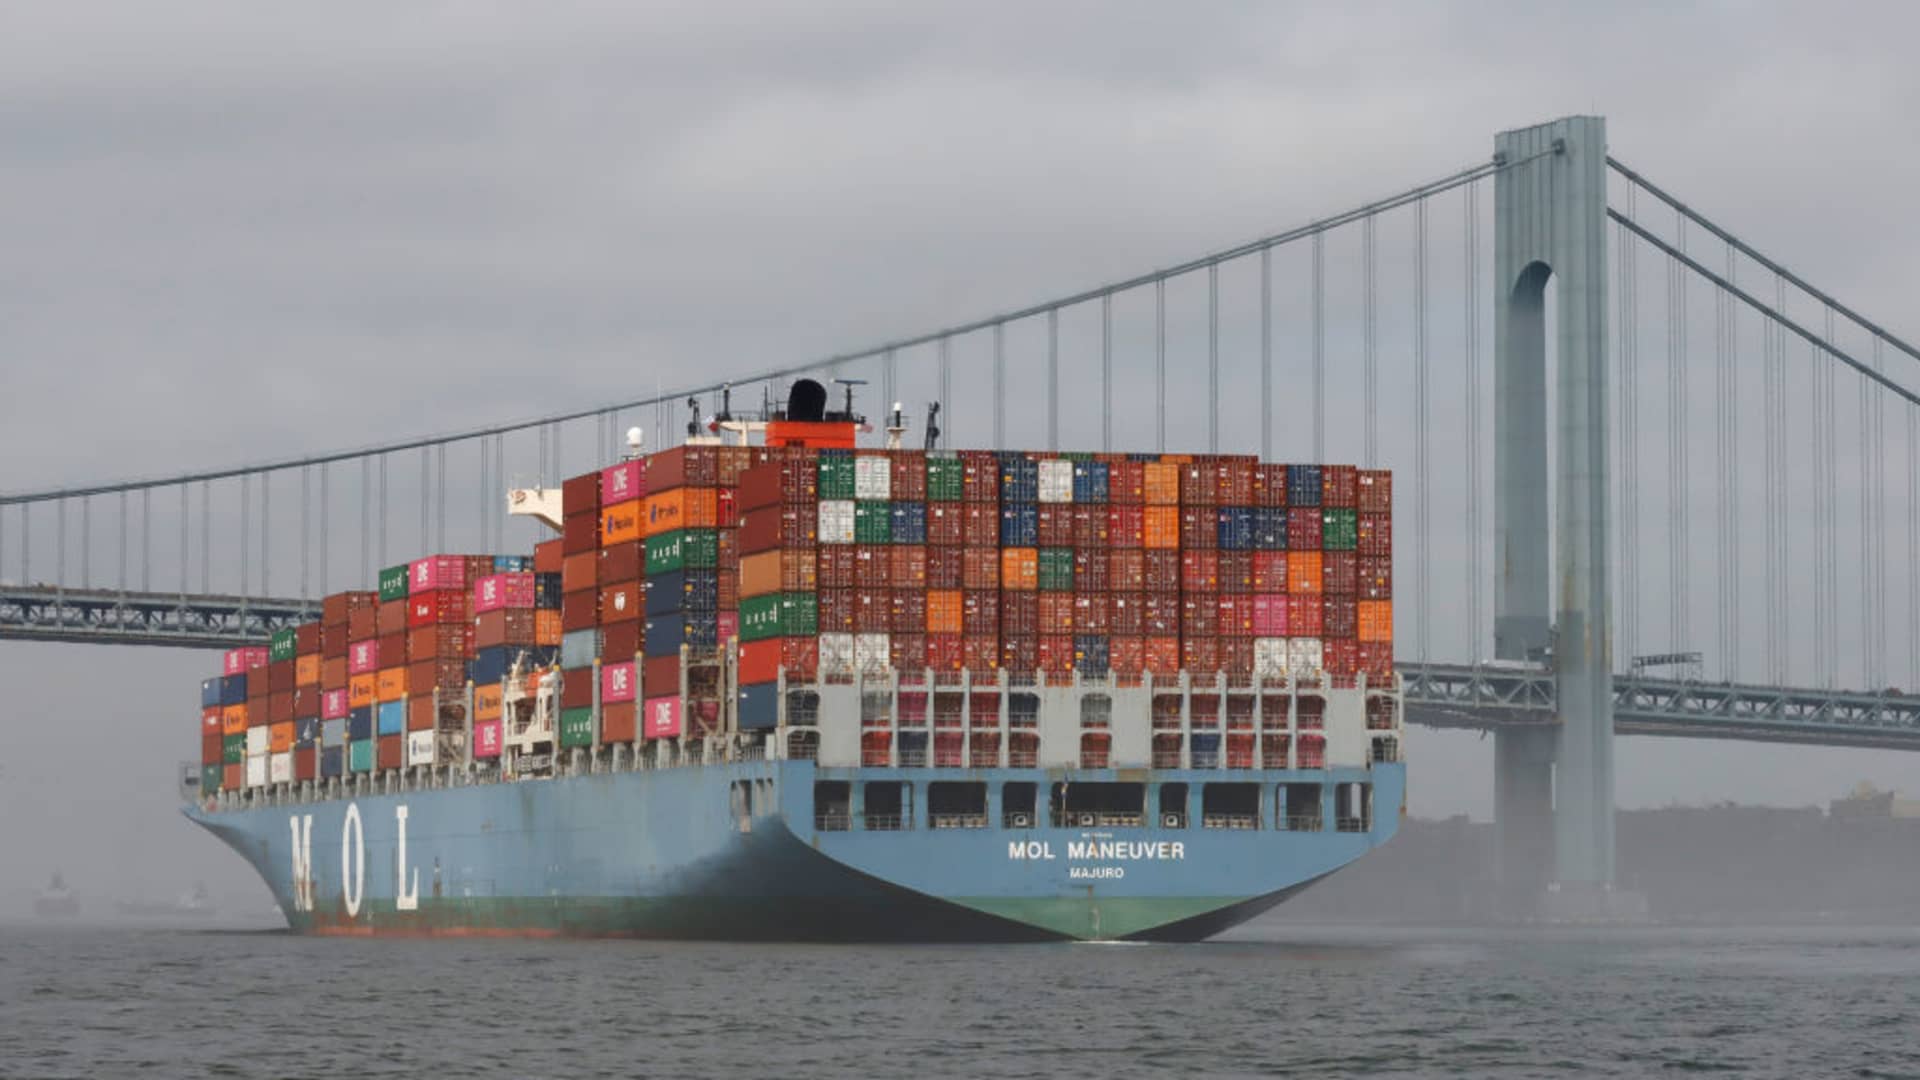
Historic import and export container processing in the month of August pushed the Port of New York and New Jersey to the No. 1 spot outpacing both the ports of Los Angeles and Long Beach.
This comes as the flow of trade continues to move away from the West Coast with logistics managers worried about a labor strike or lockout. The Port of Los Angeles ranked third in the nation in August, moving 805,314 total containers. That was 37,877 less than the Port of New York and New Jersey, which moved 843,191. The Port of Long Beach came in second, moving 806,940 export and import containers.
"We are exceeding pre-Covid numbers. It is astonishing, and it is a credit to the men and women who are moving the cargo with such efficiency," said Kevin O'Toole, chairman of the Port Authority. "Our planning with rail to complement the actual infrastructure and the dredging are allowing this added capacity that would not have happened four or five years ago."
This August was the busiest August in the history of the Port of New York and New Jersey and the fourth busiest month ever. The port's five busiest months have all occurred in 2022.
More East Coast trade, and more port congestion
The CNBC Supply Chain Heat Map for the U.S. shows how the continued increase in trade has East Coast ports and Gulf port as the winners in this movement of freight. Logistics companies and warehouses that serve these ports are also reaping the benefits of the additional containers. CSX and Norfolk Southern rails move the import and export containers on the East Coast. BNSF, owned by Berkshire Hathaway and Union Pacific move the containers in and out of the Port of Houston.
The increase in container processing is adding to the wait off the East Coast and Gulf ports. The congestion adds to delays in arrival times for manufacturers needing components to complete their products or to place finished products on store shelves to be sold.
During the week of September 19, MarineTraffic has monitored 28 container ships waiting off of the Port of Savannah with an average wait of 9.9 days. For the Port of New York and New Jersey, 12 container vessels are waiting for an average of 9 days. The Port of Houston has 25 containerships anchored, waiting on average eight days.
"While volumes are up, the congestion at the East Coast ports may be at an inflection point after months of record-breaking import levels," said Josh Brazil, vice president of supply chain insights for Project44.
Project44 data shows that the number of vessels queued at the Port of Savannah has dropped from over 30 last month to only 16 today. New York congestion is also slightly down. However, Houston is still backed up with 20 vessels, roughly the same number as last month.
"During Q4 the backlogs at ports might continue to ease by a drop in vessel numbers resulting from consumer demand slowing down," Brazil said.
Maritime prices falling
The flow of trade away from the West Coast has decreased the demand for vessel space, leading Far East to West Coast maritime freight prices to fall.
"When taking out the inflation in retail sales, U.S. retail sales were flat from last month so demand has not fallen sharply," said Peter Sand, chief shipping analyst for Xeneta. "Shippers are still bringing in a lot of containers, on the East Coast and West Coast and Gulf Coast as well."
Xeneta has tracked a new record divergence between spot rates from the Far East to the coasts.
"That is a sign of congestion all but cleared on the West Coast, with volumes coming in being manageable for ports and terminals," Sand said. That has caused rates to fall faster on the transpacific route than for East Coast-bound cargo.
Logistics prices are one of the key inflationary triggers the Federal Reserve has no control over.
"Congestion on the US East Coast is keeping rates elevated, in a combination with added disruption to that coast coming from troubles in North Europe," he added, referring to recent labor strikes by port workers in the U.K. that have stressed Europe's port network.
Shippers are still hesitant to return re-routed cargo to the U.S. West coast, Sand said.
The CNBC Supply Chain Heat Map data providers are artificial intelligence and predictive analytics company Everstream Analytics; global freight booking platform Freightos, creator of the Freightos Baltic Dry Index; logistics provider OL USA; supply chain intelligence platform FreightWaves; supply chain platform Blume Global; third-party logistics provider Orient Star Group; marine analytics firm MarineTraffic; maritime visibility data company Project44; maritime transport data company MDS Transmodal UK; ocean and air freight rate benchmarking and market analytics platform Xeneta; leading provider of research and analysis Sea-Intelligence ApS; Crane Worldwide Logistics; and air, DHL Global Forwarding; freight logistics provider Seko Logistics; and Planet, provider of global, daily satellite imagery and geospatial solutions.
"trade" - Google News
September 24, 2022 at 08:17PM
https://ift.tt/cxC2gzn
New York is now the nation's busiest port in a historic tipping point for U.S.-bound trade - CNBC
"trade" - Google News
https://ift.tt/DctlAfJ
Tidak ada komentar:
Posting Komentar